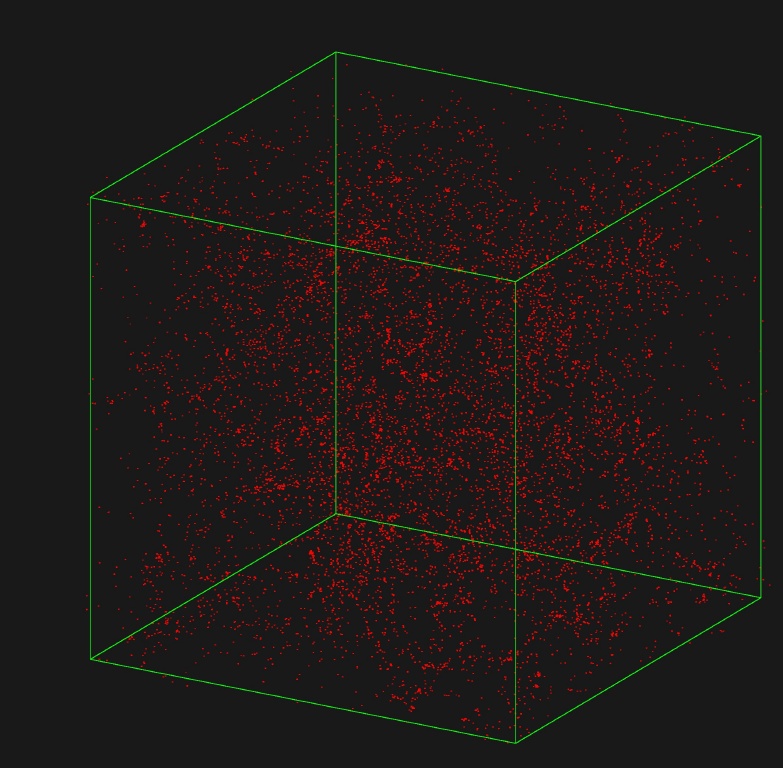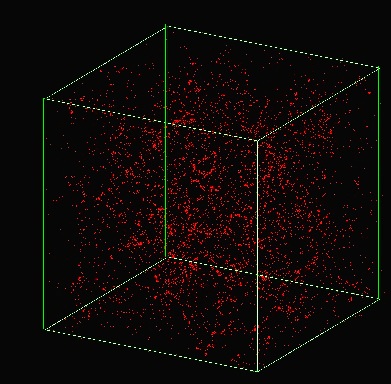
Fig.1: A random subset of the one-million particle
distribution in a cosmological simulation of a CDM universe with  m=1 and an Hubble constant of 50 Km/sec/Mpc.
The size of the box is 400Mpc = 1.3 109 light-years.
(
Click
on the image for a large view)
m=1 and an Hubble constant of 50 Km/sec/Mpc.
The size of the box is 400Mpc = 1.3 109 light-years.
(
Click
on the image for a large view)
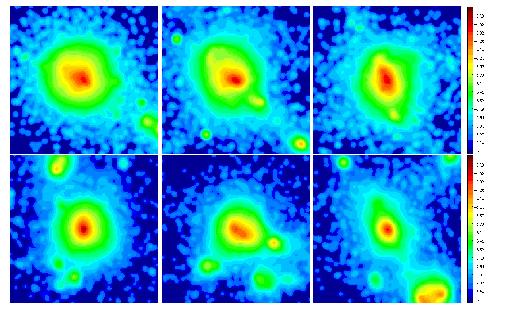
Fig. 2: X-ray emissivity maps of 4 simulated clusters
at z = 0 in a CDM universe with
m= 1 and h = 0.5. (
Click
on the image for a large view)
|
Three spatially flat cosmological models have been considered:
CDM,  CDM
with a cosmological constant accounting for 70% of the critical
density, and CHDM
with 1 massive neutrino with mass
m
CDM
with a cosmological constant accounting for 70% of the critical
density, and CHDM
with 1 massive neutrino with mass
m = 4.65 eV, yielding
a HDM density parameter
h
= 0.20 .
For CDM and CHDM h =0.5, and h=0.7
for
CDM; for all models the primeval spectral
index n=1 and the baryon density parameter
is selected to give
b h2 = 0.015.
All models were normalized in order to reproduce the present observed
cluster abundance. In order to achieve a safe statistical basis for
each cosmological model the 40 most massive clusters have been selected
from an N-body P3M simulation. (
see Fig.1
) For each of them a hydrodynamical TREESPH
simulation is run staring from the initial redshift. Details about the
simulations are widely discussed in [2].
= 4.65 eV, yielding
a HDM density parameter
h
= 0.20 .
For CDM and CHDM h =0.5, and h=0.7
for
CDM; for all models the primeval spectral
index n=1 and the baryon density parameter
is selected to give
b h2 = 0.015.
All models were normalized in order to reproduce the present observed
cluster abundance. In order to achieve a safe statistical basis for
each cosmological model the 40 most massive clusters have been selected
from an N-body P3M simulation. (
see Fig.1
) For each of them a hydrodynamical TREESPH
simulation is run staring from the initial redshift. Details about the
simulations are widely discussed in [2].
Clusters are distributed
in redshift so to reproduce the same redshfit distribution of the observed
cluster sample. The observed data set includes nearby (z < 0.2) clusters
observed with ROSAT PSPC instrument.The resulting sample
is partially incomplete, but, clusters were not selected for reasons
related to their morphology and the missing clusters are expected to
have a distribution of power ratios similar to the observed one.
For simulated clusters, power
ratios  (m)
have been computed from the gas distribution (
see Fig.2
).In this way one can perform a statistical comparison of
the global morphology of clusters, expected in each cosmological model,
with ROSAT data, using the Student t-test, the F-test and the Kolmogorov-Smirnov
test.
(m)
have been computed from the gas distribution (
see Fig.2
).In this way one can perform a statistical comparison of
the global morphology of clusters, expected in each cosmological model,
with ROSAT data, using the Student t-test, the F-test and the Kolmogorov-Smirnov
test.
Quite in general
we conclude [1] that while CDM
and CHDM
are marginally consistent with data,
CDM
is far below them. Such results seem to exclude that
CDM can be considered
a reasonable approximation to data. The best score belongs to CDM
, but also CHDM is not fully excluded.
An inspection of the model clusters actually shows that the
CDM
A possible interpretation of such output is that the actual amount
of substructures is governed by
0 rather than by the shape of power spectra.
According to the same tests, if cosmological
models are compared with data on the basis of DM
(m)
, values are shifted, indicating an increase in the amount of substructures
for DM with respect to the gas.This is to be ascribed to the smoothing
effects of the interactions among gas particles, which erase anisotropies
and structures. Hence, using DM
(m)
leads to biased scores: CDM and CHDM models keep
too many substructures and are no longer consistent with data; on the
contrary, the increase of substructures pushes
CDM to agree
with ROSAT sample outputs.
|